neuroendokrines Karzinom des Pankreas

Mixed
acinar-neuroendocrine carcinoma of the pancreas with positive for microsatellite instability: a case report and review of the literature. Preoperative contrast-enhanced computed tomography. The tumor was close to the celiac artery (CA), superior mesenteric artery (SMA) and vein (SMV), and common hepatic artery (CHA, A–D) The splenic artery was patent despite circumferential involvement by the tumor (A–C)
A mixed
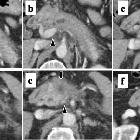
adenoneuroendocrine carcinoma of the pancreas: a case report. Abdominal contrast-enhanced computed tomography (CT) showed diffuse enlargement of the pancreas with increased CT level in the peri-pancreatic fatty tissue and revealed a mass of 2 cm in size in the pancreas head (c–d, arrow). The mass was poorly enhanced in the arterial phase and was gradually enhanced in the venous phase. The portal vein showed narrowing (b–f, arrowhead)
A mixed
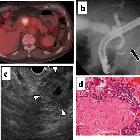
adenoneuroendocrine carcinoma of the pancreas: a case report. PET-CT revealed increased accumulation in the mass of the pancreas head (maximum standardized uptake value (SUV max): 5.6 (initial) and 7.8 (delayed) (a). Endoscopic retrograde cholangiopancreatography (ERCP) showed severe narrowing and obstruction of the main pancreatic duct by the tumor (arrow) (b). Endoscopic ultrasonography (EUS) showed the tumor as a low echoic mass (c). Cytological analysis by means of EUS-guided fine-needle aspiration (FNA) suggested a neuroendocrine tumor (G2) (d)
Metastatic
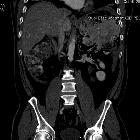
well-differentiated neuroendocrine carcinoma of the pancreas: case report and review of literature. Computed tomography (CT) of the abdomen and pelvis. A large 4.7 centimeter (cm) lobulated hypodense mass is shown in the region of the porta hepatis likely secondary to the tumor mass.
Pure
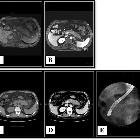
alpha-fetoprotein-producing neuroendocrine carcinoma of the pancreas: a case report. Imaging examinations. MRI showed enlargement of the pancreas body and tail with poor enhancement after gadolinium injection. Some enlarged peripancreatic lymph nodes were noted (A, B). Abdominal CT revealed diffuse enlargement of the pancreas body and tail, which appeared to be hypoattenuated with an unclear margin. A mass measuring 5.2 × 4.8 × 4.1 cm with probable encasement of the splenic vein was observed in the enlarged pancreas on contrast-enhanced CT (C, D). None of the imaging examinations revealed abnormal findings in the liver. The main pancreatic duct, common bile duct, and intrahepatic bile ducts were normal on endoscopic retrograde cholangiopancreatography (E).
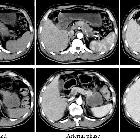
The
differentiation of pancreatic neuroendocrine carcinoma from pancreatic ductal adenocarcinoma: the values of CT imaging features and texture analysis. The computed tomography imaging findings in a 66-year-old woman with pancreatic neuroendocrine carcinoma (PNEC, white arrow) and a 62-year-old man with pancreatic ductal adenocarcinoma (PDAC, black arrow). Unenhanced and contrast-enhanced CT images at the arterial phase and portal phase showed ill-defined, hypovascular mass
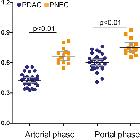
The
differentiation of pancreatic neuroendocrine carcinoma from pancreatic ductal adenocarcinoma: the values of CT imaging features and texture analysis. The contrast ratio in pancreatic neuroendocrine carcinoma (PNEC) and pancreatic ductal adenocarcinoma (PDAC) at the arterialand portal phases. The contrast ratios were higher in PNEC than PDAC

