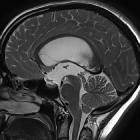
CSF flow studies


CSF flow studies are performed using a variety of MRI techniques and are able to qualitatively assess and quantify pulsatile CSF flow. The most common technique used is time-resolved 2D phase contrast MRI with velocity encoding.
Note, when referring to CSF flow in the context of imaging we are referring to pulsatile to-and-fro flow due to vascular pulsations rather than bulk transport of CSF (the mechanism by which secreted CSF circulates through the CNS via the glymphatic pathway with absorption at arachnoid granulations). The latter is too slow to be easily assessed clinically.
Phase contrast technique
Time-resolved 2D phase contrast imaging with velocity encoding is the most widely used method and relies upon location-specific sequential application of a pair of phase encoding pulses in opposite directions. Stationary protons will experience the same pulse at both times and therefore return no signal. Protons that have moved will experience different phase encoding pulses and will thus be visible .
Importantly, the expected velocity of flow needs to be taken into account if aliasing artefacts are to be avoided. This expected velocity is stated as velocity encoding (VENC) and is stated in cm/s. Typical CSF flow is 5-8 cm/s. In patients with hyperdynamic circulation much higher velocities can be encountered relying on higher VENCs (up to 25 cm/s) .
Images are typically presented in sets of 3 for each plane and VENC obtained, similar to susceptibility weighted imaging (SWI). The set comprises of :
- flow is of high signal
- background is visible
- flow is of high signal (regardless of direction)
- background is suppressed
- signal is dependent on direction: forward flow is of high signal; reverse flow is of low signal
- background is mid-grey
Quantification
Quantification of flow can be generated by defining a region of interest (e.g. cross-sectional area of the aqueduct of Sylvius) and charting velocity versus time, which is typically pulsatile (e.g. forwards during systole and backwards during diastole). The area under the curve for each cardiac phase generates values of flow forwards and flow backwards.
Clinical applications
The following clinical situations can benefit from CSF flow studies :
- aqueduct stenosis
- normal pressure hydrocephalus (NPH)
- patency of third ventriculostomy
- flow at the cervicomedullary junction (foramen magnum)
Siehe auch:

 Assoziationen und Differentialdiagnosen zu Liquorfluss:


